


A New Era of Immigration Enforcement Unfolds in the U.S. Interior and at the Border under Trump 2.0
- GAB NEWS

- Dec 20, 2025
- 7 min read

Unauthorized migration at the U.S.-Mexico border plunged dramatically during the just-ended fiscal year, as the Trump administration leveraged new border controls, further asylum restrictions, and the promise of mass deportations, reaching about 444,000 migrant encounters recorded in fiscal year (FY) 2025. This sharp drop from 2.1 million encounters the prior year was also marked by reversion to a pattern last experienced more than a decade ago: Flows primarily composed of Mexican single adults and Central American unaccompanied children.
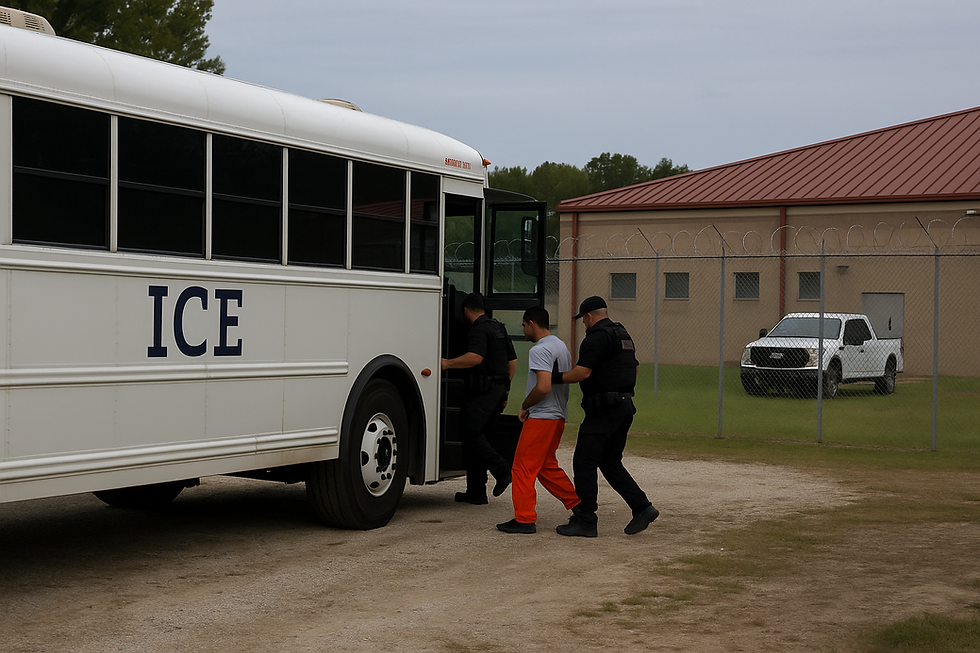
The steep decrease in unauthorized arrivals at the border and return to nationalities that are easier to turn back because of existing repatriation agreements has permitted the administration to direct its focus to immigration enforcement in the U.S. interior—in fact deploying significant U.S. Border Patrol assets to cities such as Los Angeles and Chicago. To achieve its goal of mass deportations, the administration has increased coordination among federal agencies, elevated cooperation with state and local law enforcement agencies, rapidly accelerated the build-up of detention capacity, expanded the use of fast-track removal powers, tapped the U.S. military, and established new agreements to repatriate returnees to third countries. As a result, U.S. Immigration and Customs Enforcement (ICE) recorded more deportations from within U.S. communities during FY 2025 than the Border Patrol apprehended people crossing the Southwest border illegally—the first time since at least FY 2014, according to available data.
While detailed FY 2025 data about ICE arrests and removals have not been released since January, there is no doubt that interior enforcement has risen. But it has become increasingly complicated to track results because only selective statistics have been made public. Returning to regular reporting of detailed data on immigration enforcement across the various Department of Homeland Security (DHS) immigration agencies could not only improve the public’s understanding of current immigration enforcement activities but also inform state and local stakeholders who want to collaborate or who are affected by enforcement.
Ramped-Up Interior Enforcement and Mass Deportations
While U.S. Customs and Border Protection (CBP) continues to post border encounter statistics every month, DHS has inconsistently released immigration enforcement data and its last detailed tables of ICE and CBP actions ended with November 2024 activity. Based on the latest publicly available figures, however, the Migration Policy Institute (MPI) estimates that ICE conducted about 340,000 deportations in FY 2025, including noncitizens with a formal order of removal and immigration detainees who chose to end their detention with a voluntary departure. This would mark a level of activity 25 percent higher than the 271,000 deportations recorded by ICE in FY 2024. These fiscal year figures do not include deportations conducted by CBP, which DHS has yet to release.
The administration says it conducted more than 400,000 deportations overall between ICE and CBP in its first 250 days, and was on pace to reach nearly 600,000 by the end of its first year. This projection falls short of the 685,000 deportations recorded by the Biden administration in FY 2024—and is well off the Trump administration’s pledge of carrying out 1 million deportations per year.
Location Matters
Where the deportations are happening is significantly different under the Trump administration, with more occurring within the U.S. interior rather than at the border. This has significant operational impacts, given deportations in the interior are likely to be far more resource intensive and carry higher individual and societal costs with enforcement happening in U.S. cities and against people who, unlike many recent border crossers, often have significant years of U.S. residence and deep community ties.
Of the 400,000 deportations conducted by the Trump administration through its first 250 days, MPI estimates approximately 234,000 were conducted by ICE from the U.S. interior, with another 166,000 by CBP.
ICE daily deportations, in fact, doubled from 600 in January to 1,200 since June. ICE deportations have increased as the number of immigrants being placed in detention centers has surged. Since the start of the Trump administration, the average number of noncitizens in ICE detention centers has grown gradually, reaching about 60,000 by the end of FY 2025 (see Figure 1). And by March, most detainees had been arrested by ICE in the interior, not by CBP at the border or through CBP transfer to ICE, as was usually the case under the Biden administration.
Figure 1. ICE Detainee Average, by Month and Arresting Agency, FY 2025
Note: Data on immigrant detainees are through September 20, 2025.Source: U.S. Immigration and Customs Enforcement (ICE), “FY 2025 ICE Statistics,” updated September 22, 2025.
Among detainees arrested by ICE, a shrinking share had a criminal conviction despite the administration’s pledge of targeting “dangerous criminals” and the “worst of the worst.” About 35 percent of detainees arrested by ICE had a criminal conviction in September 2025 compared to 65 percent in October 2024 (see Figure 2). Meanwhile, the share of detainees with immigration violations but no criminal charges increased from 6 percent in October 2024 to 35 percent in September 2025.
Figure 2. Detainees Arrested by ICE, by Month and Criminality, FY 2025
Note: Data on immigrant detainees are through September 20, 2025.Source: ICE, “FY 2025 ICE Statistics.”
Once in detention, it is increasingly unlikely that immigrants will be released. The share who were released on bond or under parole or supervision fell from 26 percent in October 2024, at the end of the Biden administration, to 3 percent in September 2025. In fact, 90 percent of those in ICE detention in September 2025 were deported directly from detention, compared to 63 percent of those in an ICE facility in October 2024.
How long a noncitizen spends in ICE detention depends on whether they were arrested by CBP or ICE, as well as their criminal history. The average length of detention for detainees arrested by CBP was 63 days, compared to 44 days if they were arrested by ICE. Immigrants categorized as “other immigration violator” and who were arrested by ICE had a shorter length of detention (32 days) than those with criminal convictions or charges (47 days). It is possible the difference is due to delays in criminal proceedings and/or delays in deporting individuals with criminal convictions or pending charges to their countries of origin.
Trends at the U.S.-Mexico Border
CBP recorded 444,000 migrant encounters at and between ports of entry in FY 2025, down from 2.1 million encounters a year earlier. The 238,000 encounters by the Border Patrol of migrants crossing the border without authorization represent a 55-year low. (The remaining 206,000 were encountered at ports of entry by CBP’s Office of Field Operations.)
Notably, 75 percent of the FY 2025 encounters were recorded in the last four months of the Biden administration. Irregular arrivals at the U.S.-Mexico border fell sharply at the start of the Trump administration, continuing a trend that began in January 2024 and accelerated mid-year, and have remained consistently low since. Since February, the Southwest border has seen an average of 11,000 encounters a month. In fact, daily Border Patrol interdictions reached as low as 116 in July—a far cry from the 11,000 recorded on some days during the record arrivals experienced in December 2023.
The Border Patrol effectively ended the practice termed “catch and release,” with only about a dozen encountered migrants released into the United States with notices to appear (NTAs) in immigration court. From February through September, the Border Patrol processed more than 94 percent of migrants it encountered for expedited removal, reinstatement of removal, voluntary return, or ICE detention. As much as this was the result of policy change, it was also due to the Border Patrol’s capacity to more quickly process migrants and transfer them out of its custody given that arrivals fell sharply and returned to the pattern of originating from nearby countries with which the U.S. government has long had repatriation agreements.
While these measures have reduced irregular crossings of migrants of all nationalities and demographic groups, they appear to be especially effective in reducing encounters of families and migrants from countries other than Mexico. Mexicans accounted for 45 percent of Border Patrol encounters in October 2024, a share that rose to 69 percent by September 2025 (see Figure 3). Over the same period, the share of migrants from countries other than Mexico, Guatemala, Honduras, Colombia, or Venezuela fell from 28 percent to 11 percent.
Figure 3. Share of Encounters of Migrants Crossing the U.S.-Mexico Border without Authorization, by Month and Selected Nationality, FY 2025
Source: U.S. Customs and Border Protection (CBP), “Nationwide Encounters,” updated October 24, 2025.
Similarly, as the share of “family unit” encounters (CBP’s term for an adult or minor child traveling with a family member) dropped from 27 percent to 12 percent, the share of single adults increased from 63 percent to 79 percent (see Figure 4).
Figure 4. Share of Encounters of Migrants Crossing the U.S-Mexico Border without Authorization, by Month and Demographic Group, FY 2025
Source: CBP, “Nationwide Encounters.”
This makes today’s migration patterns resemble those of 13 years ago, when most migrants arriving at the border were single adults from Mexico or unaccompanied children from Central America.
The Future of Immigration Enforcement
Whether the Trump administration reaches its goal of 1 million deportations annually or not, it has implemented a vast array of policy and operational changes that have reshaped the direction of immigration enforcement. The infusion of $45 billion from Congress to build new immigrant detention centers and $30 billion to expand enforcement and deportation operations provided under the One Big Beautiful Bill Act alone will transform ICE and further enhance cooperation with state and local law enforcement over the coming years.
Tracking and evaluating the evolution of immigration enforcement, however, will be increasingly difficult without regularly published and reliable data. Instead of releasing detailed tables on immigration enforcement each month, as done under prior administrations, the Trump administration has relied on issuing a constellation of individual statistics in press releases, tweets, and media interviews, which have conflated sources at times. This has made it difficult to verify the administration’s success against its policy objectives as well as the impacts on federal agencies, immigrants, and U.S. communities alike.
At a time when immigration enforcement has been deemed a high federal priority, it is in the national interest for the government to provide transparent, regular, reliable immigration enforcement data.


Comments